

The Analytics tab gives a single-screen overview of activity for your selected date range, with headline metrics broken down by dimension.
The Analytics tab gives you a single-screen overview of activity for the date range you pick at the top of the page. Cards across the top show the headline metrics; everything below breaks them down by dimension.
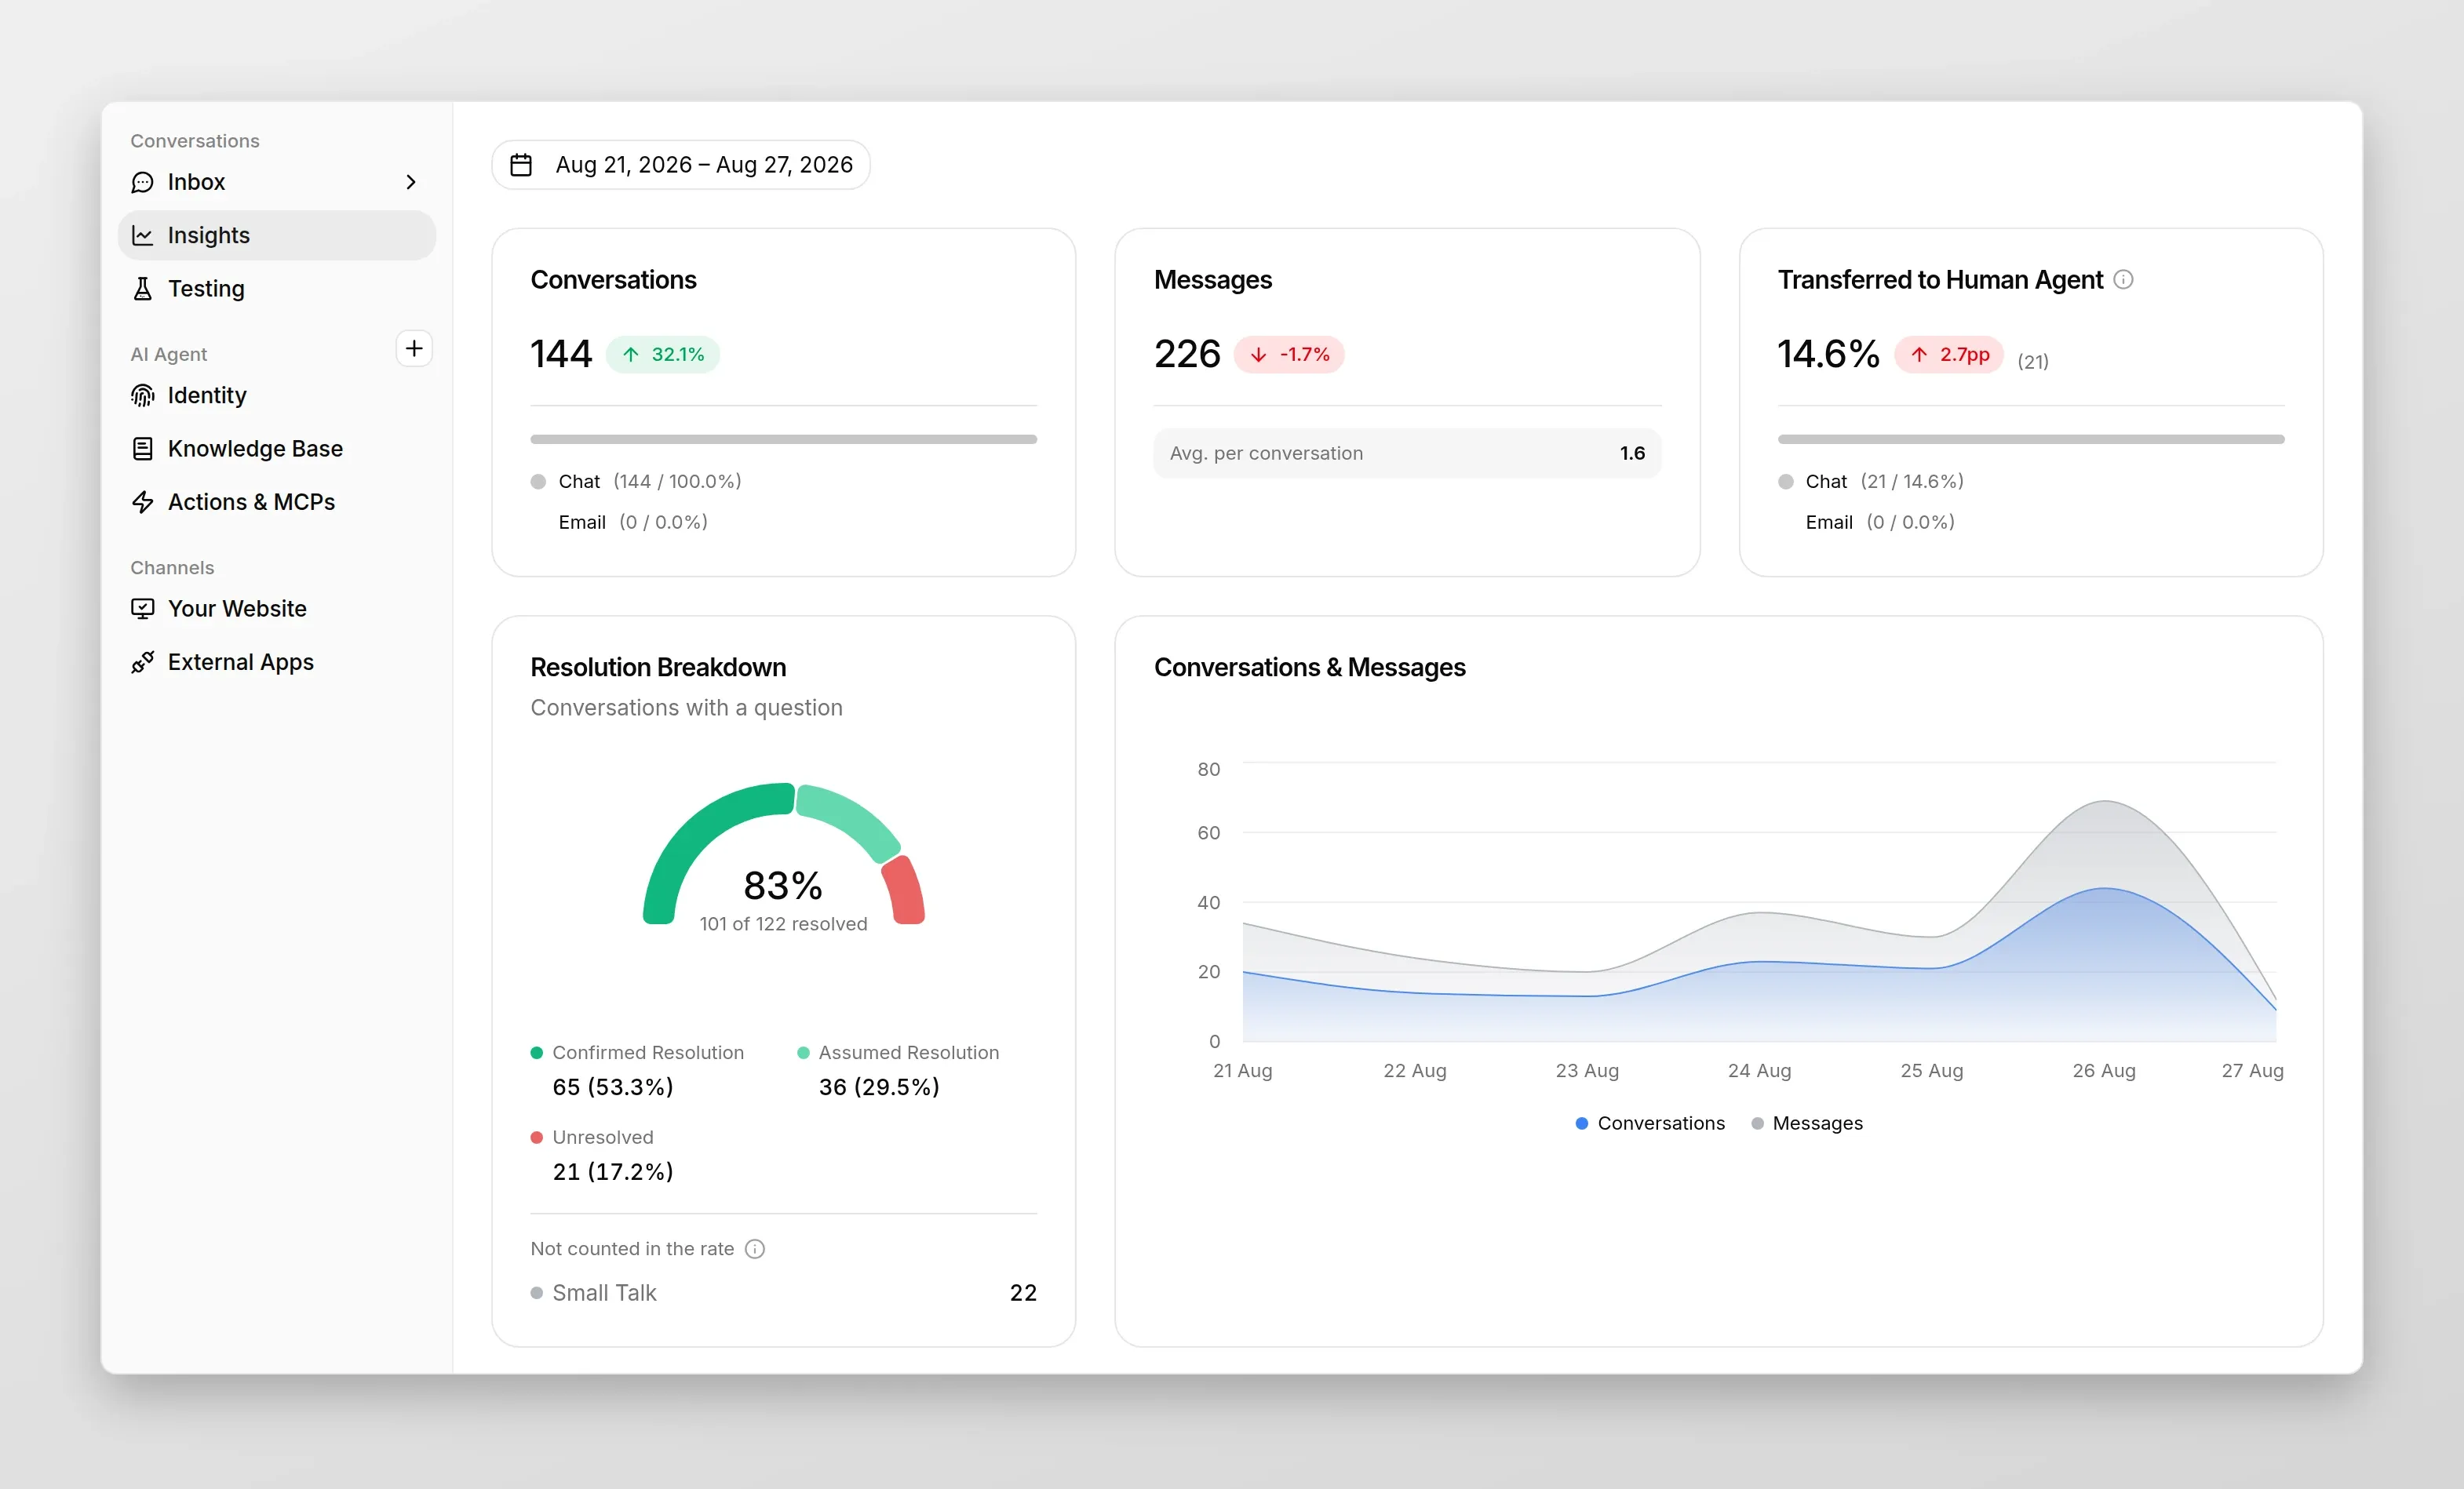
Top cards
Section titled “Top cards”Each card shows a big number for the period plus a delta against the previous comparable period (e.g., -20.5% vs the prior week).
- Conversations — total conversations handled by your AI Agent. Split underneath by source channel (Chat vs Email).
- Messages — total messages exchanged (visitor + AI), with Avg. per conversation as a subtitle.
- Transferred to Human Agent — percentage of conversations that escalated, with a percentage-point delta (e.g.,
+0.1pp). Split by channel.
Resolution Breakdown
Section titled “Resolution Breakdown”The card covers Conversations with a question, as its subtitle says. A gauge shows your resolution rate, and the buckets under it show how those conversations ended:
- Confirmed Resolution: visitor explicitly indicated the conversation was resolved.
- Assumed Resolution: no explicit confirmation, but the AI concluded the conversation likely resolved the visitor’s query.
- Unresolved: the visitor’s question was not answered satisfactorily.
Your resolution rate is (Confirmed Resolution + Assumed Resolution) ÷ (Confirmed Resolution + Assumed Resolution + Unresolved).
Not counted in the rate
Section titled “Not counted in the rate”Small talk is left out of the rate: conversations with only greetings and no question, so there is nothing to resolve. The Not counted in the rate section under the gauge still shows how many there were.
If the selected range only has small talk, the card shows No questions yet.
Conversations & Messages
Section titled “Conversations & Messages”A time-series chart of total Conversations and total Messages per day across the selected range. Use it to spot volume spikes, deployment effects, or weekend dips.
Conversations per week day / per hour
Section titled “Conversations per week day / per hour”Two distribution charts (radar + bar) that show when your visitors chat: which days of the week and which hours of the day see the most activity. Useful for staffing decisions if you have human agents picking up unresolved conversations.
Your users talk via / talk in
Section titled “Your users talk via / talk in”Two distribution charts breaking conversations down by channel (Widget, Embed, WhatsApp, Slack, Discord, etc.) and by language (English, Polish, Spanish, …). The language chart is auto-detected from the conversation — no setup required.