Insights
Last updated:
Insights is your space for analyzing conversations and understanding what your users are talking about at scale.
Tabs in Insights
- Analytics: traffic and volume overview
- AI Insights: Sentiment, Conversation Outcome, Topics, and Link Tracking
- Conversation Rating: end-of-chat feedback from users
- Manage Topics: create and edit Topics you want to track
Analytics
Section titled “Analytics”The Analytics section provides an overview of your AI Agent’s performance, summarizing key metrics about conversations, messages, and user activity.
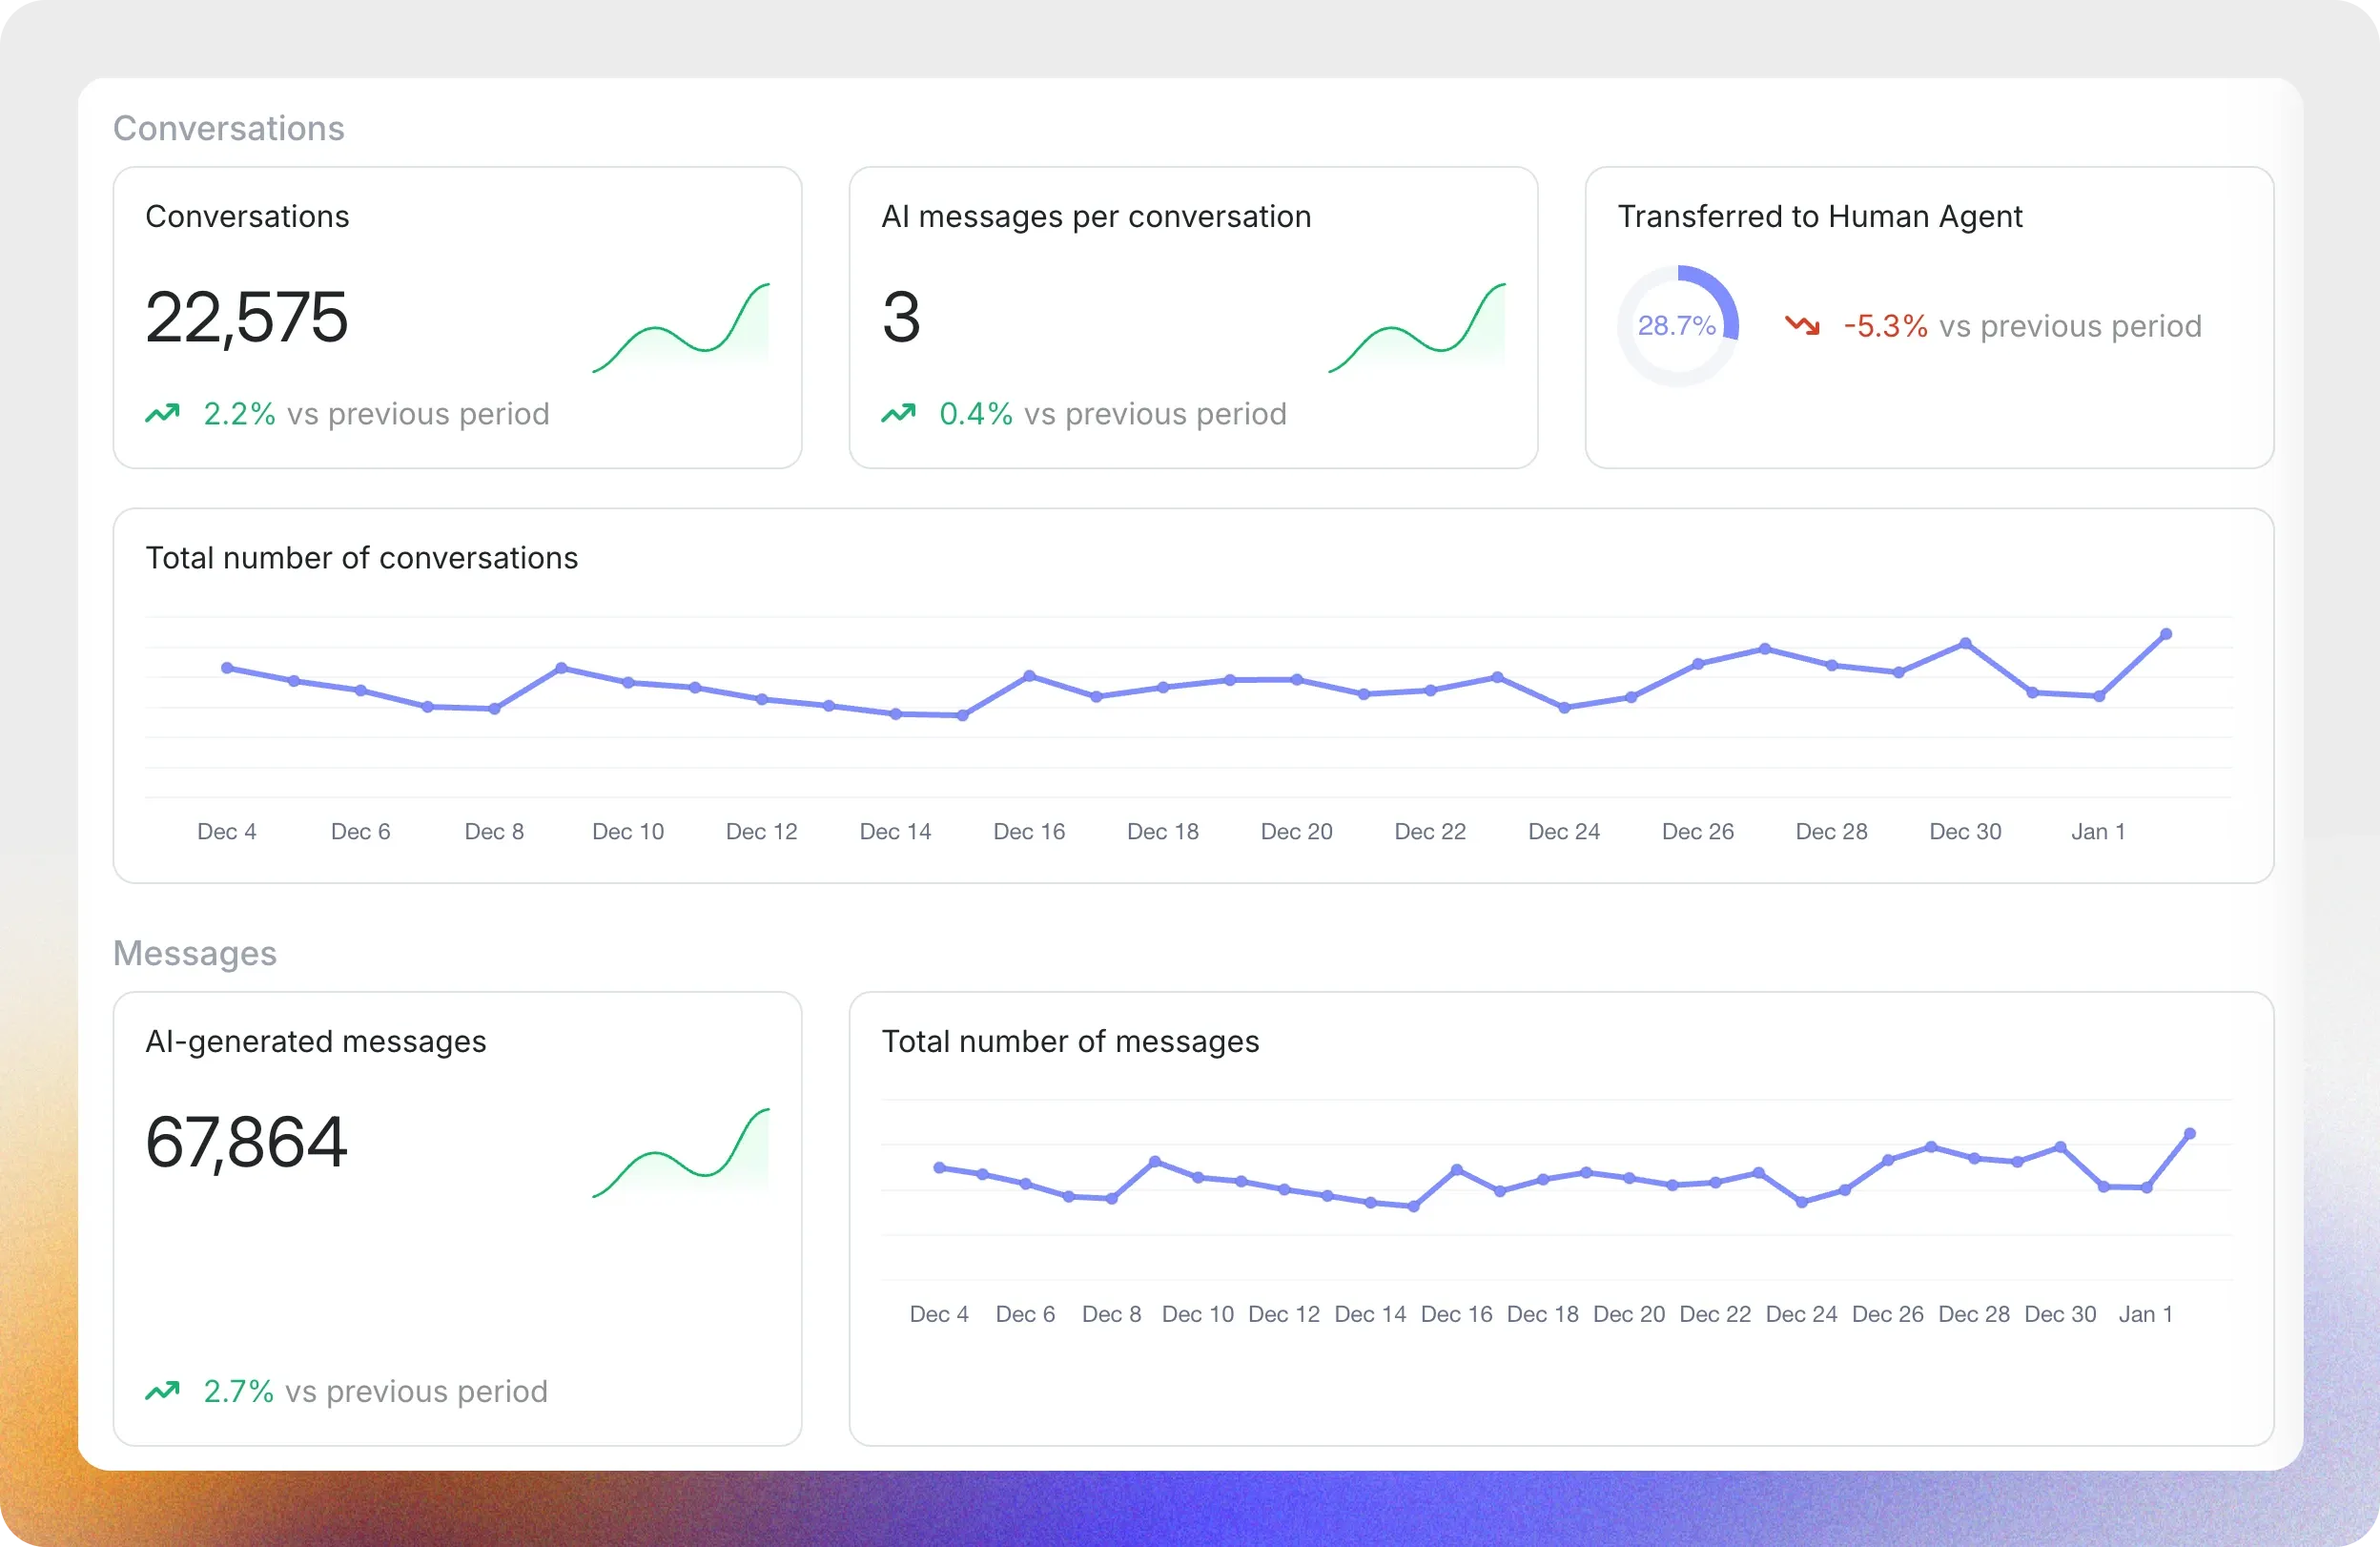
Let’s break down what each metric on the page represents.
Conversations
Section titled “Conversations”- Conversations: The total number of conversations handled by your AI Agent during the selected time period.
- AI Messages per Conversation: The average number of AI-generated responses per conversation.
- Transferred to Human Agent: The percentage of conversations escalated to a human agent.
Messages
Section titled “Messages”- Total number of Messages: The combined total of user and AI-generated messages.
- AI-generated Messages: Total number of messages sent by the AI Agent.
- Your Users Talk In: A pie chart showing the languages your users use to communicate with the AI Agent, such as English, Spanish, or Indonesian.
- Your Users Talk Via: A chart that shows which channels your users use to interact with the AI Agent (for example, Public Link, Preview, Widget).
- Messages per Weekday: A bar graph displaying the number of messages sent on each day of the week.
- Messages per Hour: A graph showing the number of messages exchanged at different times of the day so you can identify peak activity hours.
This dashboard helps you monitor and analyze the performance of your AI Agent and improve user interactions.
AI Insights
Section titled “AI Insights”AI Insights brings your higher-level analysis together on one screen: Sentiment, Conversation Outcome, Topics, and Link Tracking.
Conversation Outcome
Section titled “Conversation Outcome”See how many conversations end Resolved vs Unresolved over time. Outcome is also visible inside each conversation in the Inbox sidebar. No setup is required on supported plans.
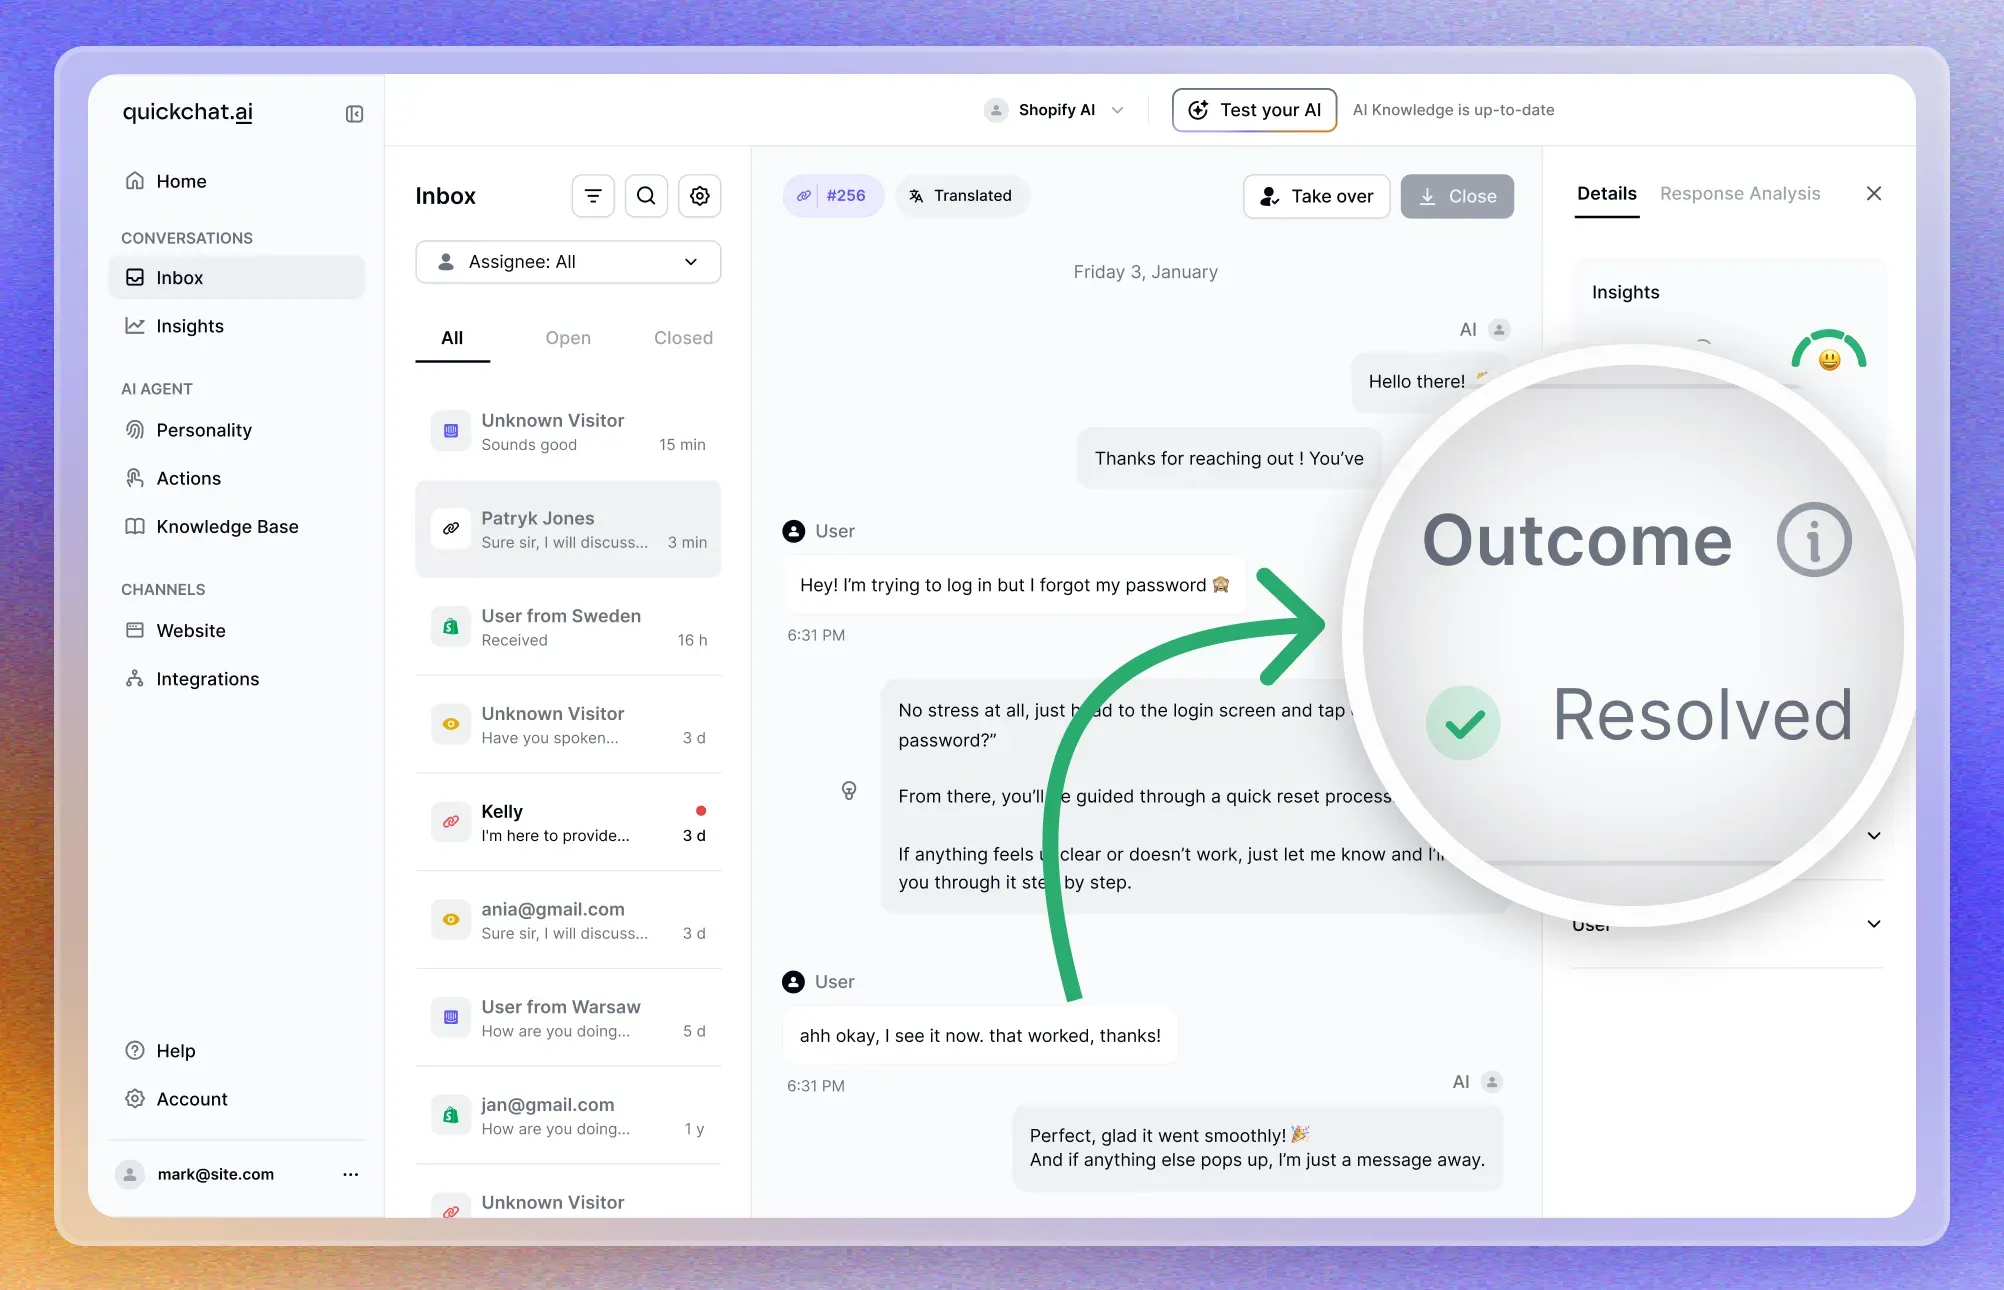
Why it helps
- Quickly spot unresolved spikes that may need human follow-up.
- Track whether changes to your AI or content improve resolution rates.
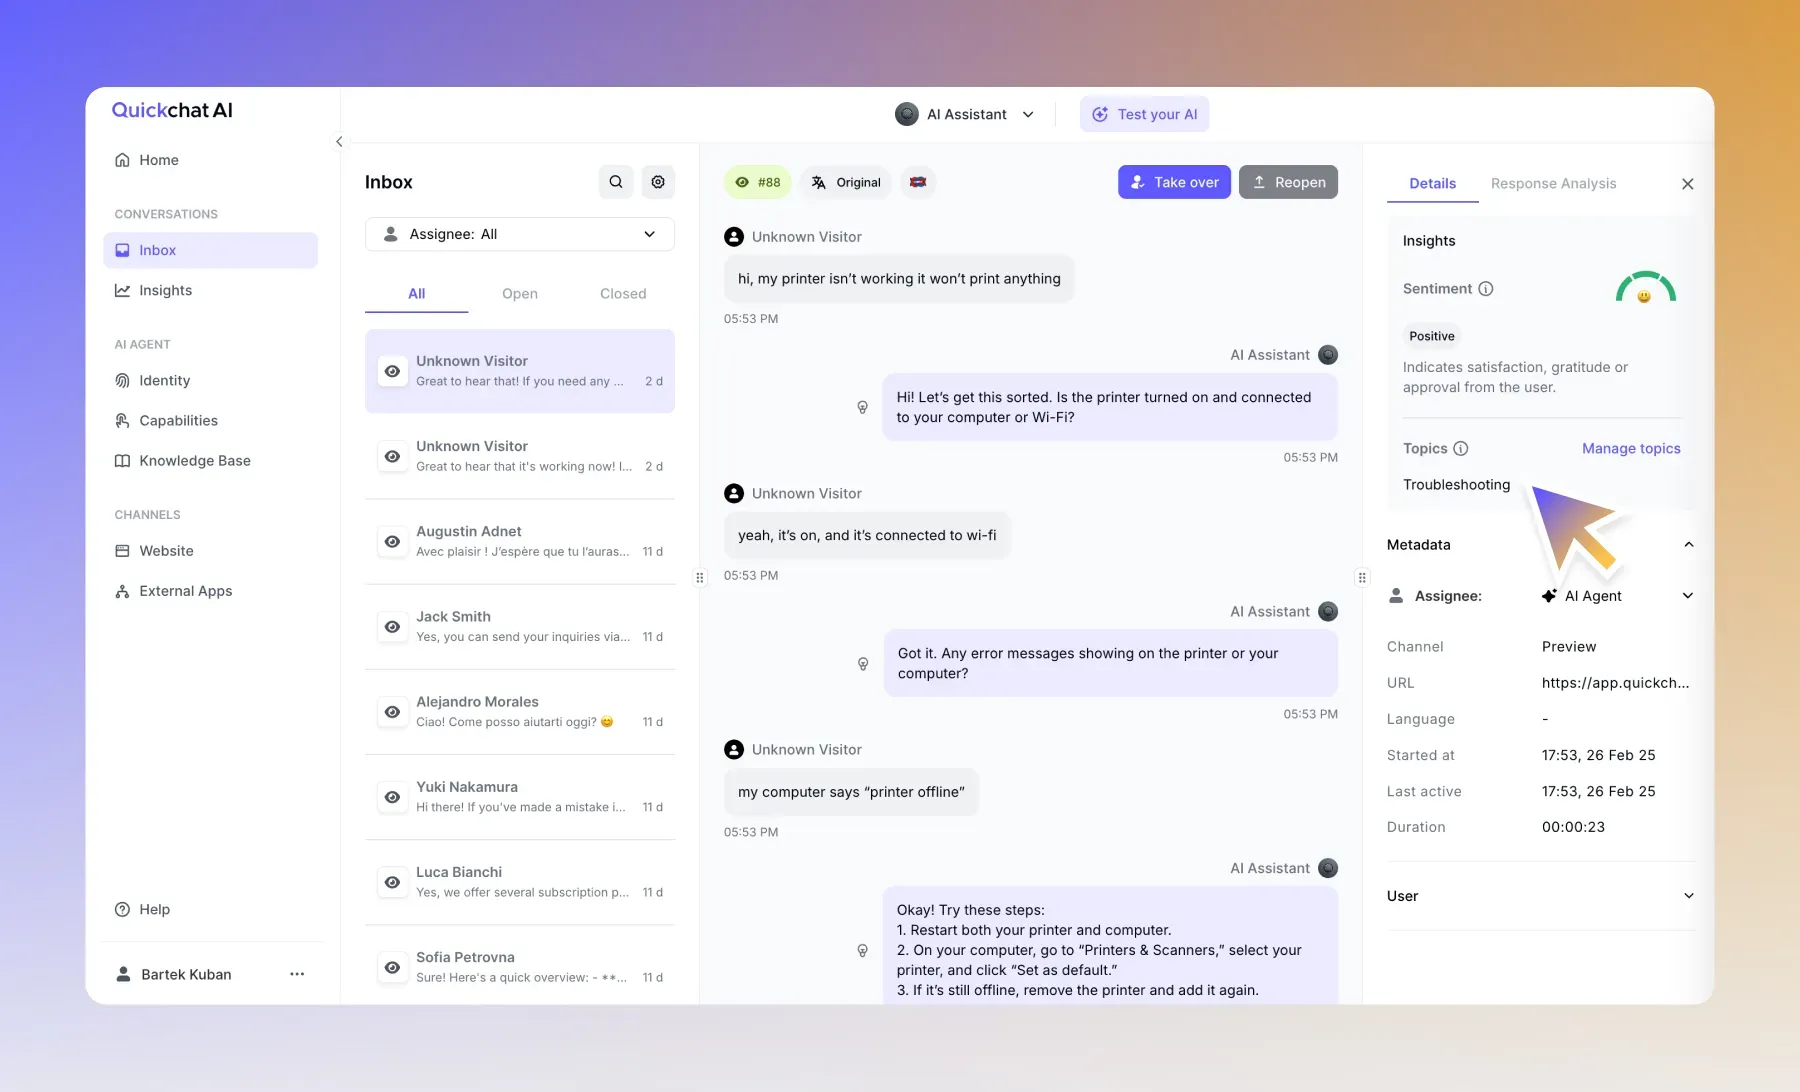
Sentiment Analysis
Section titled “Sentiment Analysis”Understand how users felt after chatting with your AI: Positive, Neutral, or Negative. You can view aggregated sentiment here and also per conversation in the Inbox sidebar. The feature is on by default.
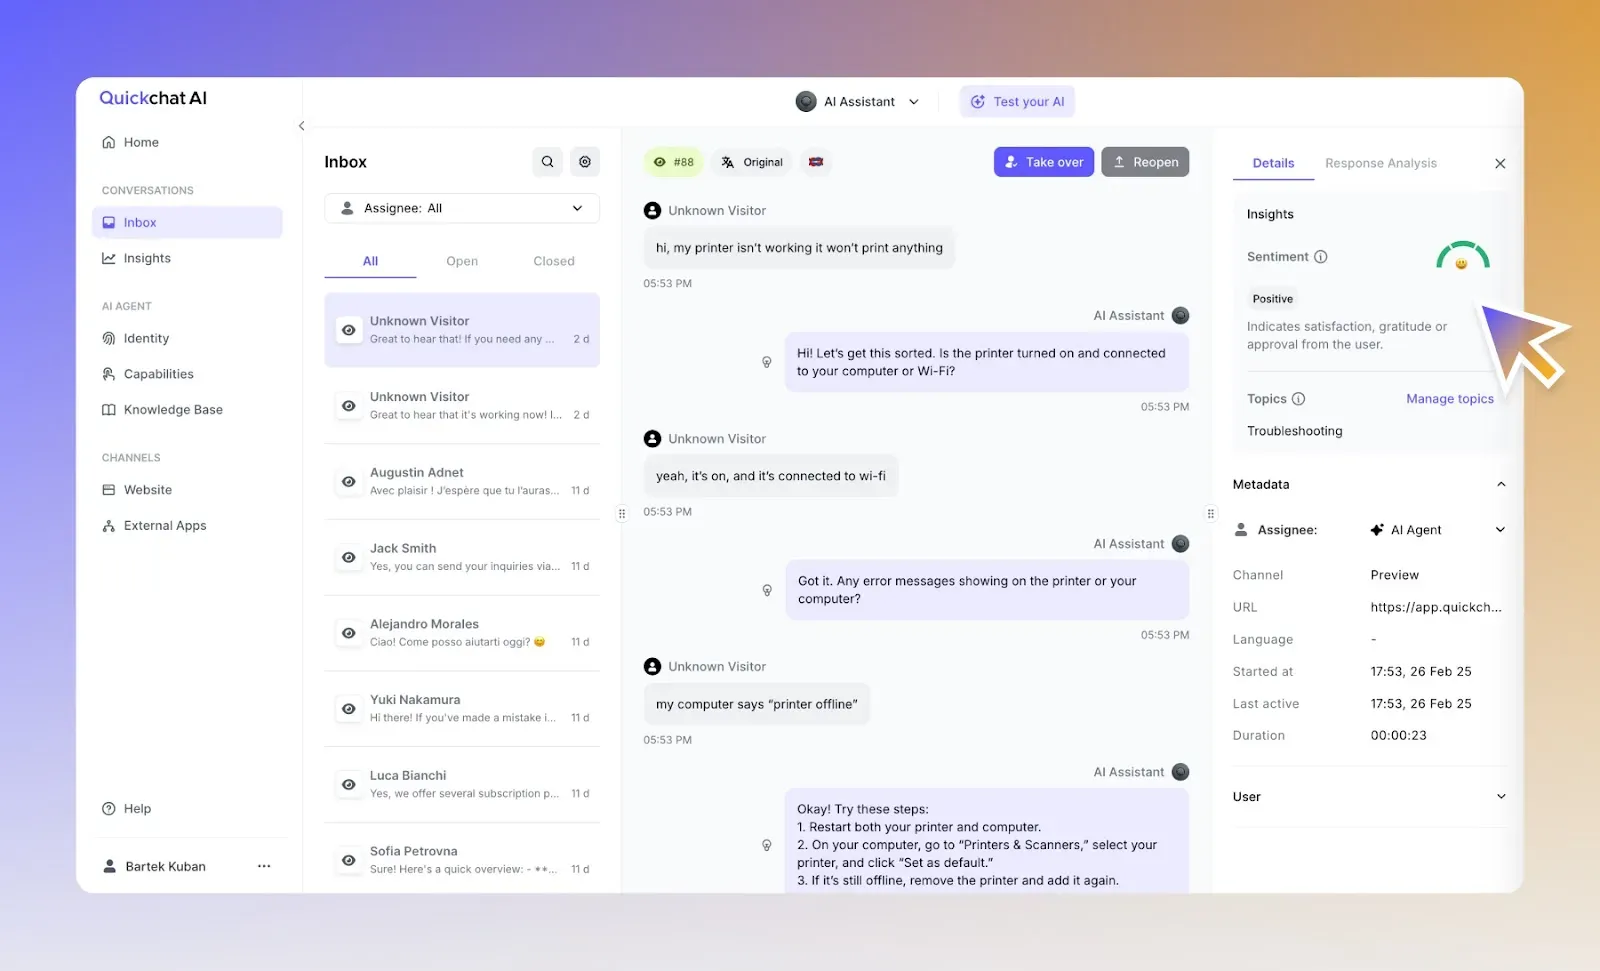
Conversation Topics
Section titled “Conversation Topics”Listening to your users is key, but doing it at scale is not easy. Topics help you track, analyze, and act on the main subjects discussed in your chats without getting lost in the details.
If you define Topics, you will see their distribution here over time. Use this to watch trends and measure the impact of product or policy changes.
Link Tracking
Section titled “Link Tracking”Track how many times users click the links your AI shares, plus the click-through rate. We automatically append UTMs to every link so you can attribute traffic and conversions in your analytics tool. In Insights you will see the top links your AI shared, total clicks, and CTR.
UTMs we add
utm_source=quickchat_aiutm_medium=referralutm_campaign=widget_{your_agent_id}utm_content={conversation_id}
Tip: In Shopify, group sessions or conversions by utm_source to see traffic from the AI Agent.
Conversation Rating
Section titled “Conversation Rating”Collect lightweight feedback at the end of chats. Users can give a thumbs up or down, answer Was the AI helpful, and optionally leave a reason or short note. Results are summarized in the Conversation Rating tab inside Insights.
Enable it
- Open Insights → Conversation Rating.
- Toggle it on.
- Now after 2nd message sent by AI the user will see a rating prompt:

When we ask for a rating
- After 30 minutes of inactivity
- After the second AI message
- When the user closes the chat
Where to read ratings
- In Insights → Conversation Rating you will see:
- How was your chat experience (distribution)
- Was the AI helpful (yes or no)
- Why was AI not helpful (reasons)
- In the Inbox, click the ⭐ icon on any conversation to check its rating status. You can also export ratings with conversations to CSV.
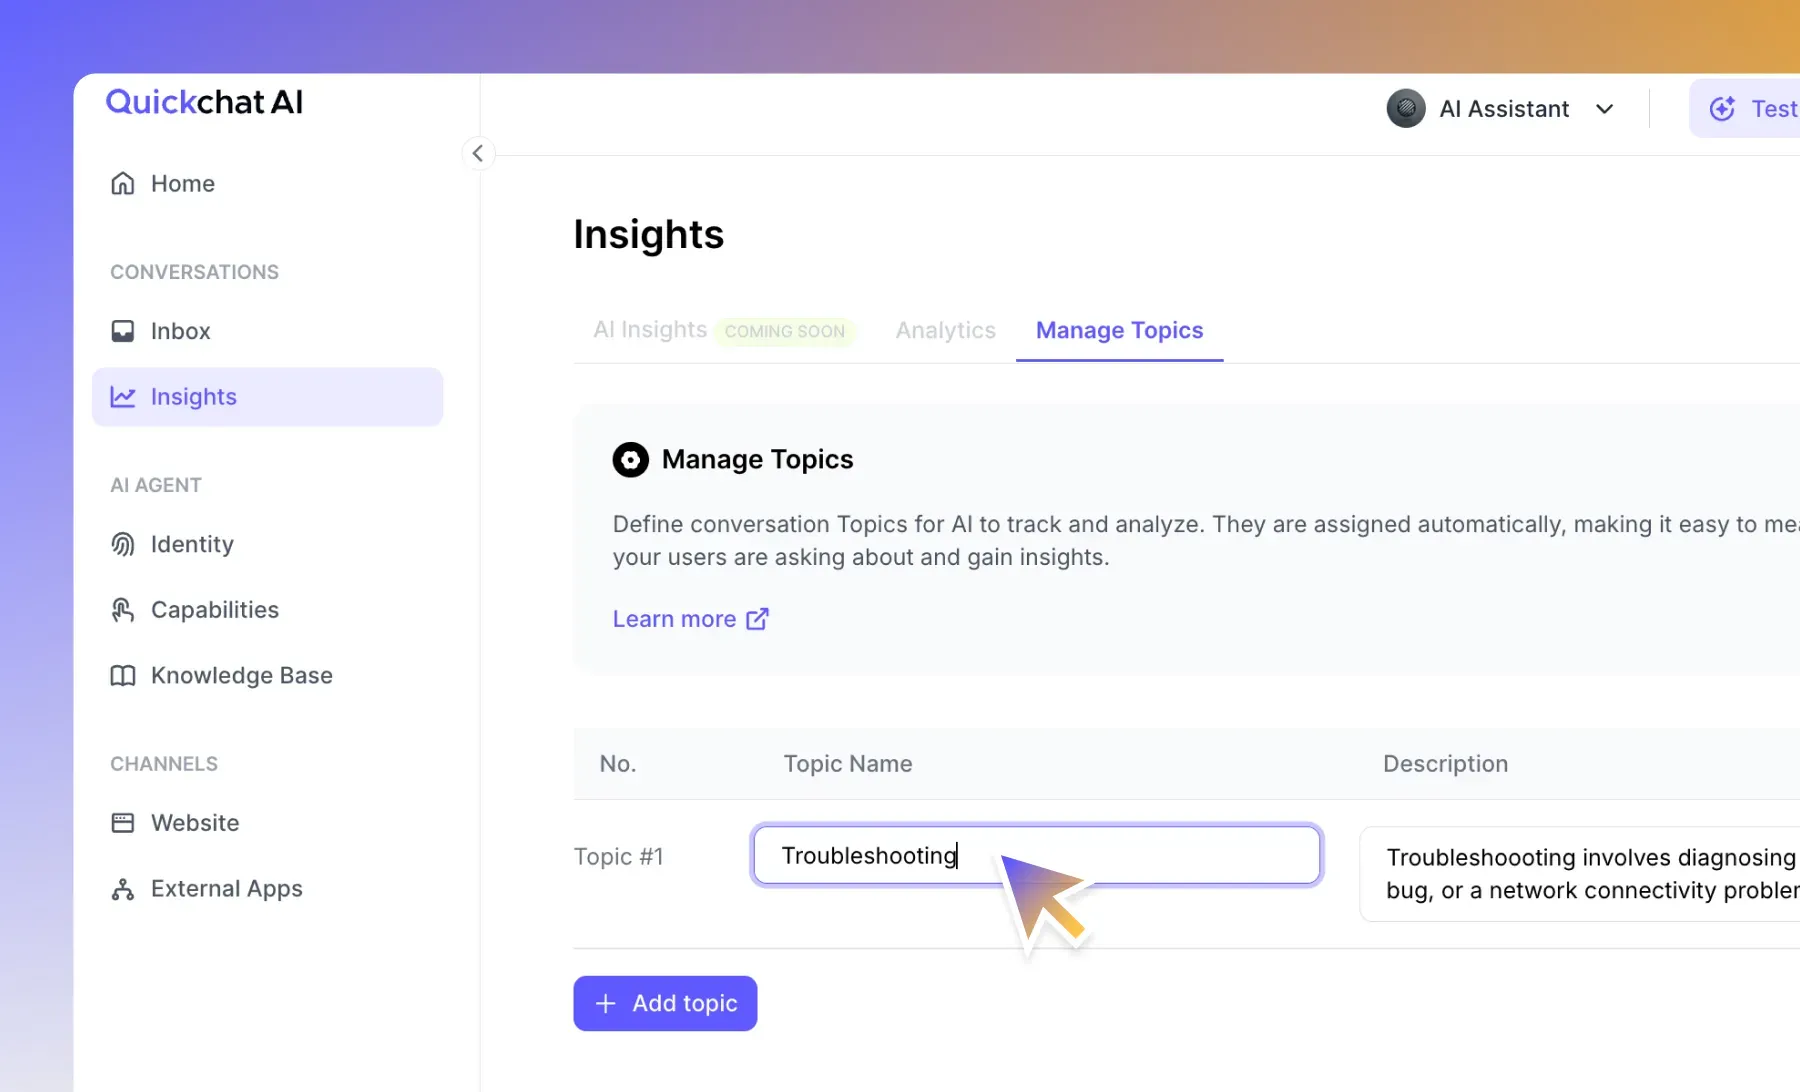
Manage Topics
Section titled “Manage Topics”What are Topics?
Section titled “What are Topics?”Topics let you define and monitor conversation subjects you care about. Our AI automatically analyzes every chat, categorizes relevant conversations, and helps you see the big picture at a glance.
Here’s how Topics can help you:
- Know the key subjects: Instantly see what your users are talking about most, like shipping, product feedback, or common questions.
- Measure the impact of changes: Launched a new feature or policy? Track how it shows up in your conversations.
- Spot trends over time: Notice patterns, such as a spike in pricing questions or recurring pain points during holidays.
How to use Topics
Section titled “How to use Topics”To get started, go to Insights → Manage Topics.
- Add Topics: Enter the topics you want to track (for example, “Shipping”, “Pricing”, “Returns”) and add descriptions for extra context.
- Automatic Tagging: The AI will assign your Topics to relevant conversations as they come in.
You will see which topics are most common and can dive into specific conversations for deeper insights.
Imagine knowing at a glance that your new return policy reduced customer confusion by 30 percent, or spotting a quiet increase in pricing questions before it becomes a bigger issue.
Topics give you actionable data — not just numbers, but insights you can use.
Ready to start?
Section titled “Ready to start?”Topics are available on the Professional and Business plans.
Enable them today and see what you uncover!
Got feedback or ideas for improving Insights? We would love to hear from you. Reach out to Patryk, our Product Lead.
We are actively building new features for Insights. Stay tuned for more ways to explore your data and drive better decisions!